Incheon port latest monthly volume
Incheon port monthly volume
(Unit : RT, %)
| Type | Import | Export | Transshipment | Coastal | Total |
|---|---|---|---|---|---|
| 2018. 12 | 10,219,136 | 2,786,011 | 71,327 | 1,796,530 | 14,873,004 |
| 2017. 12 | 10,272,935 | 2,491,507 | 31,286 | 2,308,137 | 15,103,865 |
| Value increase or decrease | -53,799 | 294,504 | 40,041 | -511,607 | -230,861 |
| Rate of Change | -0.5 | 11.8 | 128 | -22.2 | -1.5 |
| Volumes, specific gravity | 68.7 | 18.7 | 0.5 | 12.1 | 100 |
Incheon port monthly containervolume
(Unit : TEU, %)
| Type | Import | Export | Transshipment | Coastal | Total |
|---|---|---|---|---|---|
| 2018. 12 | 136,672 | 133,347 | 2,849 | 643 | 273,511 |
| 2017. 12 | 139,912 | 135,111 | 2,390 | 610 | 278,024 |
| Value increase or decrease | -3,240 | -1,764 | 459 | 33 | -4,513 |
| Rate of Change | -2.3 | -1.3 | 19.2 | 5.4 | -1.6 |
| Volumes, specific gravity | 50 | 48.8 | 1 | 0.2 | 100 |
Incheon port monthly bulk cargovolume
(Unit : RT, %)
| Type | Import | Export | Transshipment | Coastal | Total |
|---|---|---|---|---|---|
| 2018. 12 | 7,226,571 | 1,190,726 | 22,455 | 1,792,046 | 10,231,798 |
| 2017. 12 | 7,273,798 | 1,343,509 | 1,516 | 2,303,639 | 10,922,462 |
| Value increase or decrease | -47,227 | -152,783 | 20,939 | -511,593 | -690,664 |
| Rate of Change | -0.6 | -11.4 | 1,381.2 | -22.2 | -6.3 |
| Volumes, specific gravity | 70.6 | 11.6 | 0.2 | 17.5 | 100 |
Incheon Port Main Volume
Total Cargo Traffic
(Unit: 1,000 RT, %)
| Category | 2013 | 2014 | 2015 | 2016 | 2017 | |||||
|---|---|---|---|---|---|---|---|---|---|---|
| Traffic | Rate of Change | Traffic | Rate of Change | Traffic | Rate of Change | Traffic | Rate of Change | Traffic | Rate of Change | |
| Total | 146,106 | 1.5 | 150,084 | 2.7 | 157,624 | 5 | 161,304 | 2.3 | 165,521 | 2.6 |
| Import | 88,973 | 1.3 | 93,930 | 5.6 | 98,123 | 4.5 | 100,448 | 2.4 | 105,861 | 5.4 |
| Export | 23,133 | 8.7 | 23,561 | 1.9 | 24,732 | 5 | 24,310 | △ 1.7 | 26,905 | 10.7 |
| Transshipment | 533 | -8.7 | 571 | 7.3 | 670 | 17.2 | 435 | △ 35.0 | 518 | 19.1 |
| Coastal | 33,468 | -2.3 | 32,021 | -4.3 | 34,099 | 6.5 | 36,112 | 5.9 | 32,237 | △10.7 |
Bulk Cargo Traffic
(Unit: 1,000 RT, %)
| Category | 2013 | 2014 | 2015 | 2016 | 2017 | |||||
|---|---|---|---|---|---|---|---|---|---|---|
| Traffic | Rate of Change | Traffic | Rate of Change | Traffic | Rate of Change | Traffic | Rate of Change | Traffic | Rate of Change | |
| Total | 109,518 | -1.1 | 110,710 | 1.1 | 118,234 | 6.8 | 118,921 | 0.6 | 119,407 | 0.4 |
| Import | 66,386 | -1.1 | 68,540 | 3.2 | 71,840 | 4.8 | 71,649 | △ 0.3 | 73,776 | 3.0 |
| Export | 10,658 | 5.7 | 10,194 | -4.4 | 12,033 | 18 | 11,100 | △ 7.8 | 13,495 | 21.6 |
| Transshipment | 199 | -13.1 | 279 | 40.2 | 352 | 26.2 | 141 | △ 60.1 | 84 | △40.3 |
| Coastal | 32,274 | -3.1 | 31,697 | -1.8 | 34,008 | 7.3 | 36,031 | 5.9 | 32,053 | △11.0 |
Container Traffic
(Unit: 1,000 RT, %)
| Category | 2013 | 2014 | 2015 | 2016 | 2017 | |||||
|---|---|---|---|---|---|---|---|---|---|---|
| Traffic | Rate of Change | Traffic | Rate of Change | Traffic | Rate of Change | Traffic | Rate of Change | Traffic | Rate of Change | |
| Total | 2,161 | 9 | 2,335 | 8.1 | 2,377 | 1.8 | 2,680 | 12.7 | 3,048 | 13.8 |
| Import | 1,113 | 10.7 | 1,203 | 8.1 | 1,224 | 1.7 | 1,374 | 12.2 | 1,528 | 11.2 |
| Export | 996 | 8.8 | 1,104 | 10.9 | 1,126 | 2 | 1,281 | 13.7 | 1,451 | 13.2 |
| Transshipment | 18 | -13.3 | 17 | -5.2 | 17 | 0.9 | 16 | △ 6.9 | 24 | 56.2 |
| Coastal | 35 | -24.7 | 11 | -68.3 | 10 | -11 | 9 | △ 7.8 | 45 | 397.4 |
Vessel Port Entry Status
(Unit: 1,000 RT, %)
| Category | 2013 | 2014 | 2015 | 2016 | 2017 | |||||
|---|---|---|---|---|---|---|---|---|---|---|
| Number of Vessels | Rate of Change | Number of Vessels | Rate of Change | Number of Vessels | Rate of Change | Number of Vessels | Rate of Change | Number of Vessels | Rate of Change | |
| Total | 17,621 | 0 | 17,700 | 0.4 | 18,766 | 6 | 18,708 | △ 0.3 | 18,118 | △3.2 |
| Ocean Going Vessels | 7,894 | 0.3 | 7,550 | -4.4 | 8,211 | 8.8 | 8,245 | 0.4 | 8,380 | 1.6 |
| Coaster | 9,727 | -0.3 | 10,150 | 4.3 | 10,555 | 4 | 10,463 | △ 0.9 | 9,738 | △6.9 |
Vessel Demurrage Status
(Unit: 1,000 RT, %)
| Category | 2013 | 2014 | 2015 | 2016 | 2017 | |||||
|---|---|---|---|---|---|---|---|---|---|---|
| Vessels in Demurrage | Demurrage Rate | Vessels in Demurrage | Demurrage Rate | Vessels in Demurrage | Demurrage Rate | Vessels in Demurrage | Demurrage Rate | Vessels in Demurrage | Demurrage Rate | |
| Total | 100 | 1.27 | 45 | 0.6 | 59 | 0.72 | 143 | 1.73 | 109 | 1.30 |
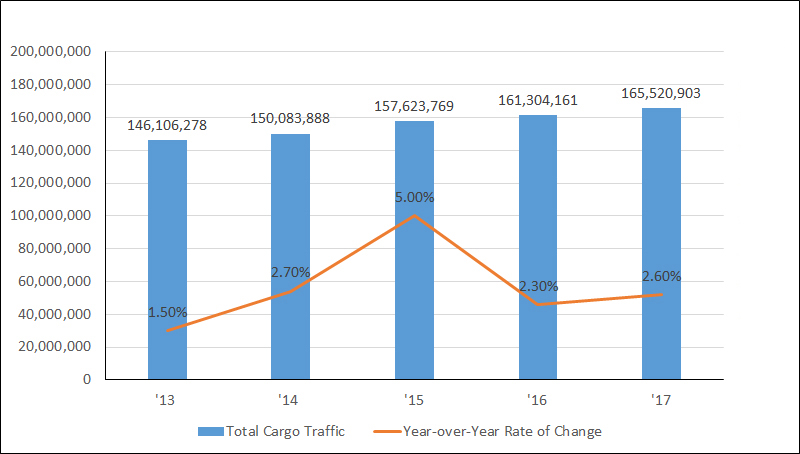
Yearly Total Cargo Traffic Graph
| Category | Total Cargo Traffic | Year-over-Year Rate of Change |
|---|---|---|
| '13 | 146,106,278 | 1.50% |
| '14 | 150,083,888 | 2.70% |
| '15 | 157,623,769 | 5.00% |
| '16 | 161,304,161 | 2.30% |
| '17 | 165,520,903 | 2.60% |
Total Cargo Traffic
(Unit: 1,000 RT, %)
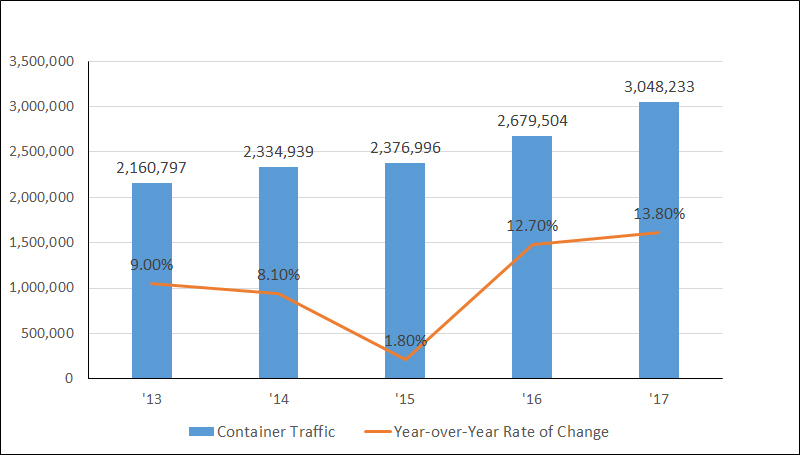
| Category | Container Traffic | Year-over-Year Rate of Change |
|---|---|---|
| '13 | 2,160,797 | 9.00% |
| '14 | 2,334,939 | 8.10% |
| '15 | 2,376,996 | 1.80% |
| '16 | 2,679,504 | 12.70% |
| '17 | 3,048,233 | 13.80% |
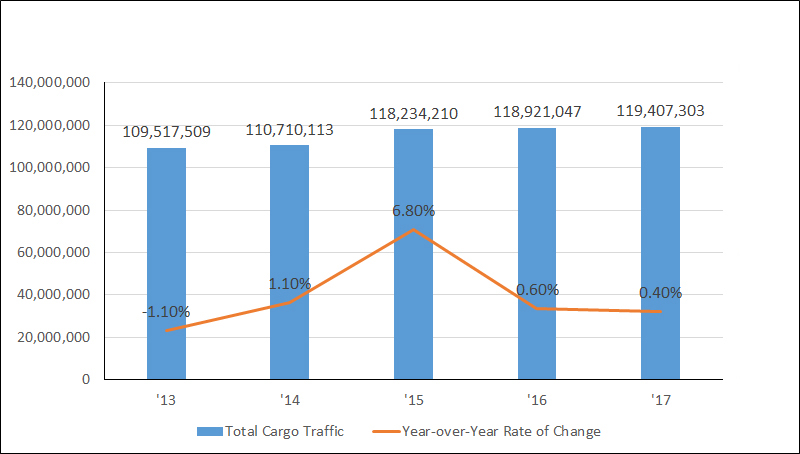
Yearly Bulk Cargo Traffic Graph
| Category | Bulk Cargo Traffic | Year-over-Year Rate of Change |
|---|---|---|
| '13 | 109,517,509 | -1.10% |
| '14 | 110,710,113 | 1.10% |
| '15 | 118,234,210 | 6.80% |
| '16 | 118,921,047 | 0.60% |
| '17 | 119,407,303 | 0.40% |
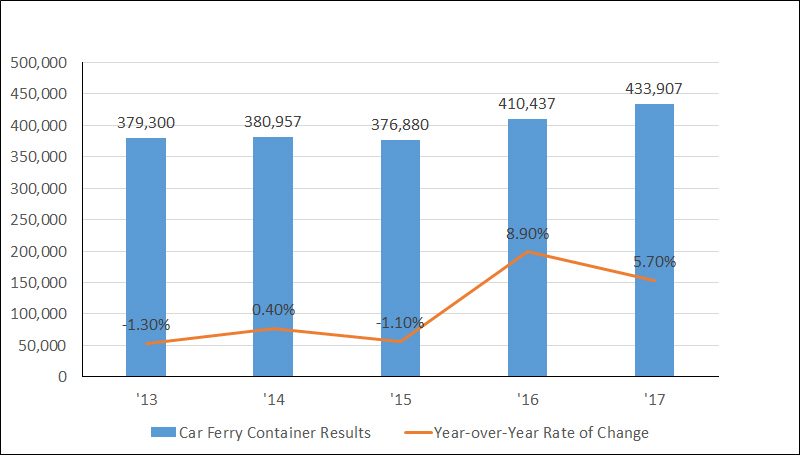
Yearly International Car Ferry ContainerTraffic
| Category | 2013 | 2014 | 2015 | 2016 | 2017 |
|---|---|---|---|---|---|
| Car Ferry Container Results | 379,300 | 380,957 | 376,880 | 410,437 | 433,907 |
| Year-over-Year Rate of Change | -1.30% | 0.40% | -1.10% | 8.90% | 5.70% |